Category Archives: Science fair ideas

Science Fair Idea: Re-orienting Your Globe

1972MarEE

Fifty years ago this month, the March 1972 issue of Elementary Electronics showed this idea to improve the utility of the globe in your radio room. Normally, the globe is mounted so that it spins just like the Earth–along its axis. But you’re not required to spin the globe, and it becomes more useful if you orient it so that it can turn along an axis through your location and your antipode–the point furthest away from you.  If you’re in North America, that would be somewhere in the Indian Ocean.

The advantage of doing this is that it quickly lets you see the direction and distance to any other point.  The thing holding the globe in place (known as the semi-meridian) is usually marked in degrees.  But you can tape a scale in miles to it, and if you rotate any point on the globe toward that line, you’ll instantly see the number of miles.

All you need to do is remove the globe from its mounting, which is usually just a matter of slipping it out.  You then drill a new hole at your location and at the opposite side, and remount it.

The student desiring to bring home the blue ribbon at the science fair will quickly realize that this simple project will answer the question of “how to convert a globe into a distance measuring instrument.”


Some links on this site are affiliate links, meaning this site earns a small commission if you make a purchase after clicking the link.

Science Fair Idea: “Lens” for Sound

1937MarPSFor students looking for a simple but impressive (and slightly dangerous) science fair experiment, this one from the March 1937 issue of Popular Science is almost certain to bring home the blue ribbon. It demonstrates that sound waves can be manipulated with a “lens” in the same way that light can. In this case, the “lens” is made up of a balloon filled with carbon dioxide. Since the CO2 is heavier than air, a bubble full of this gas refracts the sound waves. This can be shown, as hear, by using the “lens” to amplify a distant sound. To prove the effect, another balloon filled with normal air can be compared.  If the teacher requires that the project answer a question, then the question can be, “can sound waves be focused in the same way as light waves?”

To generate the carbon dioxide, the method suggested by the magazine is to place some limestone into a bottle containing muriatic acid.  The balloon is placed on the bottle and quickly inflates with the carbon dioxide produced by the reaction.

WARNING: Muriatic acid is another name for hydrochloric acid, and it’s very dangerous. You need to take precautions from getting it on your skin, and especially your eyes, since it could blind you. Do this part of the experiment outside, wear eye protection, and follow these other safety precautions. But you can get the muriatic acid at your local hardware store or on Amazon.  For children too young to handle the acid, a parent or teacher can produce the carbon dioxide and give the balloon to the child. The balloon full of CO2 is perfectly safe.


Some links on this site are affiliate links, meaning that this site earns a small commission if you make a purchase after clicking the link.

Anemometer With No Moving Parts

1957FebPE10If Junior wants to take home the blue ribbon at the next science fair, this project will almost certainly provide it. When Junior announces to the science teacher that he or she is going to build an anemometer (an instrument for measuring wind speed) with no moving parts, the teacher will be mystified, and will wonder whether it is even possible. But when they see the completed device in action, they will be astonished at its simplicity.

1957FebPE11The anemometer consists of a Wheatstone bridge circuit, which consists of four resistors. Two of the resistors are actually thermistors of equal value. As long as their resistance remains equal, the meter shows a reading of zero. But if they are unequal, then the meter displays a current. The two thermistors are placed outside at the spot where the wind is to be measured. When they are energized, they heat up slightly, which causes their resistance to change. As shown at left, both are mounted in a small plastic container, but one of those containers has small holes drilled in it. When it is exposed to the wind, it is cooled, but the other thermistor is not. The stronger the wind, the greater the cooling, and the current increases. In other words, as the wind increases, it is shown on the meter.

Once the meter is built, it needs to be calibrated, and that requires Junior to “enlist the services of a competent automobile driver” on a “highway which permits maximum state speed limits.” The driver accelerates to 60 MPH, and Junior holds the thermistor assembly out the window, as far as possible. (We note that Junior should take care not to have the arm amputated by a passing truck.) Junior then adjusts the instrument so that it indicates a full scale reading on the meter. The measurement is taken again at different speeds, and the meter reading is noted.

When Junior is awarded the blue ribbon for this elegantly simple design, the teacher will undoubtedly be thinking, “why didn’t I think of that?”

The original construction article, from the February 1957 issue of Popular Electronics, called for a “matched pair” of thermistors, since they need to have equal values. While it might not be possible to buy a matched pair, there is an inexpensive alternative. Junior can buy this set of 100 thermistors on Amazon at a very reasonable price. It includes 10 each of different values, including the needed 2kΩ. Junior just needs to measure all ten, and then use the two that are the closest in value. The remaining 98 thermistors can be used for other experiments. In fact, by adjusting the values of the other resistors, another value of thermistor could be used.

1957FebPE22


Some links on this site are affiliate links, meaning that this site earns a small commission if you make a purchase after clicking on the link.

Illusion: Candle Burning in Bottle of Water

1937FebPS01For a simple illusion that can be part of a science fair project, this self-explanatory diagram shows how to make a candle look like it’s burning inside a bottle of water.

A plate of glass is placed as shown.  Since it allows light to pass through, but also reflects light, when it’s viewed at the correct angle, it appears that the candle is inside the bottle of water.

This idea appeared 85 years ago this month in the February 1937 issue of Popular Science.


Party Game Idea

1961DecRadioConstrSixty years ago this month, the December 1961 issue of the British publication Radio Constructor gave some ideas for devices to liven up a Christmas party or, for that matter, any party. According to the author, the self-explanatory design here was an “oldie,” but was largely forgotten. To play the game, one needed to move the ring from one side to the other without touching the metal rod.  According to the magazine, this feat required a remarkably steady hand, and was no doubt good for many hours of fun as the guests made an attempt.

The magazine noted that if the party was one for charity, then the guests could be charged a fee to play, earning a refund if they were able to successfully move the ring from one side to the other without sounding the bell.

Perhaps if Junior is looking for a science fair project, this one could be used as a basis for determining which of their classmates had the steadiest hand.


Science Fair Idea: Electrostatic Precipitator

1946DecPS1946DecPS2Seventy-five years ago this month, this young woman undoubtedly took home the blue ribbon of the 1946 Science Fair with this experiment in which she constructed an electrostatic precipitator to fight air pollution.  In the photo above, a column of smoke is rising.  But the moment she flips the power switch on her precipitator, the smoke ceases.  An electrostatic precipitator, known at the time as a Cottrell precipitator after its inventor Frederick Gardner Cottrell, removes particulate matter from the air through an electric charge, but does not affect the flow of gas. The same principle is used in home air purifiers such as this:

In the 1946 experiment, a column of polluted air passes through a mailing tube, where it passes through a high voltage electric field. Particulate matter clumps together as a result of the electric charge, and falls to the bottom of the tube.

We enjoy providing inspiration for projects such as these, and we hope modern school children can do the same experiments. And for this project, your young scientist will need the following items. Where available, we have provided links to Amazon:

As you see, Amazon no longer has all of the needed parts. The Model T spark coil is apparently out of production. And while this young woman had no problem bringing a pack of Chesterfields to school and nonchalantly lighting one up in the science classroom to show off her invention, it’s no longer 1946. If a kid did that today, they would probably get expelled. So if Junior wants to do this experiment today, some modification is necessary.

Fortunately, as long as your young scientist has some creativity, substitutions shouldn’t be a problem. In place of the cigarette, the original 1946 experiment allows for the use of an incense stick, and as long as Junior has the teacher’s permission, this shouldn’t be a problem.

The Model T spark coil, however, is a bit more problematic. The spark coil from a Model T was known as a trembler coil.  The device was a transformer. To be able to operate with DC, the coil operated in interrupter: When voltage was applied to the coil, the magnetic field opened the contacts of the interrupter, which turned off the coil. With the coil off, the contacts closed, allowing the coil to re-energize. The result of this on-off action was an alternating current, and the voltage of this alternating current was stepped up to thousands of volts with the transformer.

The Model T spark coil remained in production for many years after the last Model T rolled off the assembly line, and many of them found their way into things other than cars. When this experiment was published in Popular Science in December 1946, there was apparently no question that if you wanted a Model T spark coil, that finding one wouldn’t be a problem. One popular use of the coil in the early days of radio was for use in a spark-gap transmitter.

But if you walk in to the parts counter of your local Ford dealer today, they probably don’t have them any more. (On the other hand, there are still Model T’s on the road, and if you want to buy a new spark coil, they are still being made, but they’re probably too expensive, such as this one.)

The advanced student should be able to build their own induction coil. They will need a transformer and a method of interrupting the current. Experimentation with a filament transformer and mechanical buzzer will probably prove fruitful. Our earlier post describing a spark coil should give the advanced student enough information to construct one that is essentially identical to the Model T version.

The school might already have the equivalent stashed away in the back room of the science lab, or you could convince the teacher to spend some of the science budget on one of these:

Some links on this site are affiliate links, meaning that this site earns a small commission if you make a purchase after clicking on the link.


1961 Student-Built Radio Telescope

1961NovEISixty years ago this month, the November 1961 issue of Electronics Illustrated featured this radio telescope constructed by high school student H. Mark Wahl of Cheyenne, Wyoming. The rack containing the electronics was a school locker. The door of the locker was removed to form the door, and the equipment was mounted facing what used to be the back.

The equipment consisted of a standard FM broadcast receiver which had been converted to AM by eliminating the limiter and discriminator. A tuned RF amplifier, apparently for 108 MHz, was added to beef up the sensitivity. The IF output was connected to what looks like a Hallicrafters S-30B tuned to 10.7 MHz. This fed two recorders, one connected to the voice coil of the receiver’s speaker, and the other one connected to the S-meter. The recording of the audio output was accomplished with a pivoted wooden arm. The other end held a pen which recorded on a strip of paper driven by a motor.

The recorder hooked to the meter consisted of a straw from a broom, which recorded a trace on a soot-covered cylinder turned by a wind-up alarm clock, creating a 12 hour record.

The antenna consisted of two folded dipole antennas, probably made out of TV twin lead, mounted horizontally and parallel to each other, about a hundred feet apart. With identical lengths of feed line, the signals would arrive in phase, and be identical. The antenna pattern would have a number of lobes, one of which was straight up. However, if an additional half wavelength of feedline was added to one side, the two signals would arrive out of phase. The pattern would be similar, but the signal from straight up would be nulled out. By using the difference of these two signals, the interferometer was able to null out everything but the signal from straight up. Thus, any terrestrial interference would be eliminated, and the antenna would see only the cosmic noise coming in from directly overhead.

While we think of most radio astronomy taking place at higher frequencies, there’s no reason why frequencies just above the FM broadcast band can’t be used. For example, this 2014 experiment used 38 European radio telescopes to detect radio signals from a distant galaxy on 115 MHz. Those 38 dish antennas probably provided a better signal than two folded dipoles a hundred feet apart, but they used the same principles to combine the signals.

Unfortunately, the article doesn’t give too many practical details on the construction of the set. And other than the author’s assertion that it was “relatively simple, but it works,” there’s little detail on what observations he made.

We’ve previously written about another group of students in Britain who built a radio telescope in 1959.  This website specializes in science fair projects that a student and frazzled parents can whip together in one evening, and we have many that fit that category.  Building your own radio telescope is definitely not in that category. But students were doing so 60 years ago, and there’s really no reason why an advanced student (or maybe a student who’s not so advanced, but just likes to tinker with electronics) can’t do the same thing today.


Some links on this site are affiliate links, meaning this site earns a small commission if you click on the link and make a purchase.

Science Fair Idea: Global Warming & Obliquity of the Ecliptic

1936NovPS1If Junior wants to perform a somewhat contrarian and controversial science fair experiment, he or she can perform an experiment to answer the following question:

“Can global warming be caused by reduction in the obliquity of the ecliptic?”

The science teacher won’t be able to react immediately, because he or she probably doesn’t know what “obliquity of the ecliptic” is. But after they consult Wikipedia, they’ll understand the concept, and they might have to grudgingly concede that there’s something to it. “Obliquity of the ecliptic” is just a fancy term for the angle at which Earth’s axis of rotation is tilted. Today, it’s about 23.4 degrees. But 8000 years ago, it was 24.2 degrees, and it’s been going down ever since.

1936NovPS2With this experiment from 85 years ago, Junior will be able to demonstrate that as the tilt decreases, the ice pack at the poles will increase. In the illustration above, the Earth is covered with “ice” to about the same extent that it is today–it’s north of the Arctic Circle. But if the tilt is increased, the extent of the ice pack covers much more of the hemisphere, as shown at left.

The experiment to demonstrate this appeared in Popular Science 85 years ago this month, November 1936. The Earth is represented by a rubber ball. A hole is drilled through the center and a knitting needle is inserted, to serve as the axis. The earth is then dipped in melted paraffin wax and covered to a depth of about 1/16 inch, representing ice. A high-wattage light bulb serves as the sun, and the ball is mounted as shown and rotated. After about a half hour, a layer of wax covers the area north of the Arctic Circle. The remaining wax drips off onto the mounting board. In the real world, this melted ice would enter the oceans.

The experiment is then repeated with a larger angle, and the “ice” covers much of the hemisphere.  Junior has demonstrated that the extent of arctic ice increases as the obliquity of the ecliptic increases, and decreases as the obliquity of the ecliptic decreases.  Since the obliquity of the ecliptic is currently decreasing, it stands to reason that this is a cause of the arctic ice decreasing.  And if the teacher believes that some other cause is at work, then he or she can come up with an experiment.  Junior can remind the teacher that this is how science works.

Which is Cheaper: Gasoline or Ethanol?

ethanolmolecule

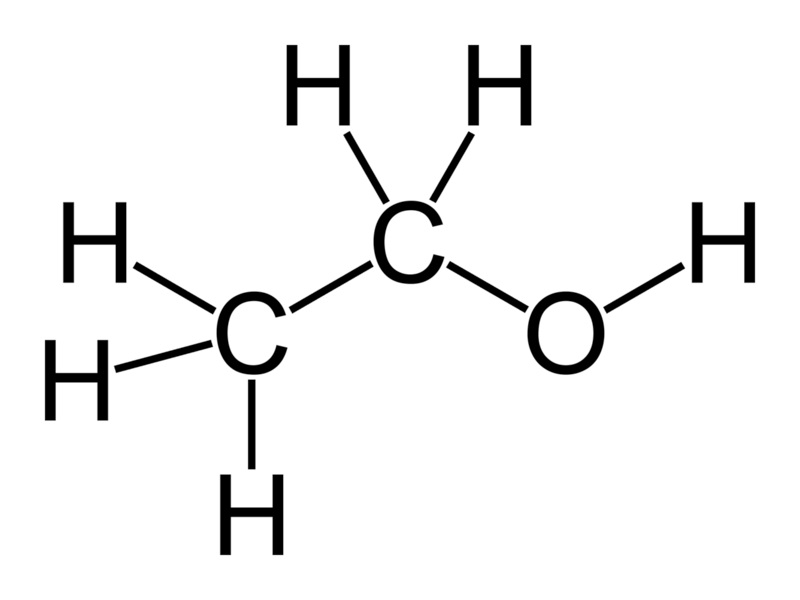
Gasoline versus Ethanol

Shown above is a molecule of ethyl alcohol, also known as ethanol.  If you ignite it with a spark, it will burn. This is not rocket science.  (Come to think of it, though, if you use it as rocket fuel, then it is rocket science.)  Gasoline (or petrol, as our friends across the pond like to call it) is a mixture of molecules, most of which look very similar to the one above. If you ignite it with a spark, it will also burn. The difference, however, is the “O“. Gasoline doesn’t have any oxygen atoms. To burn it, you need to supply all of the oxygen from another source. Fortunately, that’s easy to do, since we live in an atmosphere consisting partly of oxygen, and it’s free for the taking.

But this means that for a given amount of fuel, the ethanol will have less energy content: If you burn gasoline, you can use the free oxygen that is floating around. If you use ethanol, then you are paying for some of the oxygen, which you could have gotten for free.

For this reason, I’ve heard many people explain that you shouldn’t use ethanol as fuel, because your fuel mileage will be lower. But that’s not the end of the discussion: If you’re like me, you are really concerned about saving money, and your main concern is which fuel is cheaper.

A Real World Comparison Test

MSPEscanabaI’ve heard many persons express their opinion as to the relative fuel economy, but I’ve never heard anyone actually test it, so I decided to do so myself. I recently had to drive from St. Paul, MN, to Escanaba, MI, to do an FCC Great Lakes Ship Radio Inspection. I drove eastbound using e85, a mixture of approximately 85% ethanol and 15% gasoline, and drove westbound with gasoline (which is actually e10, 90% gasoline and 10% ethanol). For the nitpickers, here are the conditions of the test:

To make sure I was able to purge almost all of the E85 from the system before the return trip, I tested the mileage from St. Paul, MN, to Marinette, WI, short of my final destination. I started with a full tank, and upon arriving in Marinette, I checked the cumulative mileage and then added about 6 gallons. I also added a few gallons in Escanaba, MI, about 56 miles away. When I arrived back in Marinette, I was down to about a quarter tank, at which point I filled with gasoline (actually, e10) for the trip home. So almost all of the e85 had been purged from the system for the trip home.

My vehicle is a 2014 Dodge Journey with the 3.6 liter 6 cylinder engine. The EPA estimated highway mileage is 25 MPG with gasoline, and 18 MPG with e85. The two endpoints have similar elevations (795 feet in St. Paul, versus 594 in Marinette). Winds on the day of my trip were light, and whenever I did see flags moving in the breeze, the prevailing wind seemed to be from the north. So there should be no effect from a headwind or tailwind. I took an identical route both directions, mostly over four lane freeways, but a small portion over county highways suggested by Google. In other words, the driving conditions both directions were more or less identical. The average mileage reading was taken from the car’s computer, which was reset after each fill-up.

The average mileage using e85 was 21.6 MPG. The average mileage using gasoline (actually e10) was 26.4 MPG. As noted above, the mileage with ethanol was lower, since the fuel has a lower energy content. The real question is which fuel is cheaper.

To make the comparison fair, I’ll use the prices at the same station, the one where I bought the e85: The e85 cost $2.229 per gallon. In other words, it cost me $2.229 to drive 21.6 miles, or 10.32 cents per mile. (I actually used a loyalty card, which brought the cost down to $2.029 per gallon, or 9.4 cents per mile).

The gasoline I bought for the return trip cost $3.239 per gallon, since one gallon allows me to drive 26.4 miles, that means I spent 12.3 cents per mile. But in fairness, if I had bought that gas for the eastbound trip at the same place where I bought the e85, it would have cost $3.099 per gallon, which works out to 11.7 cents per mile.

In other words, it was cheaper to drive using the e85: 10.3 cents per mile versus 11.7 cents per mile. In other words, the e85 is 12% cheaper than using gasoline.

It should be noted that these figures are based upon the price at one particular station, a Holiday gas station.  You can view the current prices at this station at this link.  Some gas stations sell e85, but at a much smaller discount over the price of regular gasoline. In fact, I’ve occasionally seeing a station inexplicably selling e85 for more than the price of regular gasoline. Obviously, it makes no sense to buy to buy there. To be economical, the price of e85 needs to be below 21.6/26.4 = 82% the price of regular gas. In my case, the price of e85 was 74% the cost, and thus a clear bargain.

Other Considerations

There are a couple of other factors to keep in mind. Even though the name of the fuel is “e85” the exact blend can vary. During the winter months, the gasoline content is higher, and I have noticed that stations do not adjust the price based upon the exact mix. So during the winter, the e85 might be an even greater bargain.

Also, I have not measured it, but I have noticed that when I have a mixture that is around 50% ethanol and 50% gasoline, I don’t notice much mileage difference between it and 100% gasoline. So even though the energy content is lower, the actual effect on mileage might not be linear. It would be interesting to repeat this experiment with different blends.

I’m not sure of this, but I suspect that for applications requiring more power (such as towing), gasoline would have a greater advantage. But again, I’ve not tested this hypothesis.

And you will certainly have more range using gasoline than you would ethanol. So if cost isn’t an issue, but you need to drive as far as possible before refueling, then you will be able to drive 22% further by using gasoline.

I suspect that ethanol might have a greater cost advantage for high altitude driving. The reason why there is a lower energy content is because the fuel contains oxygen, which is available at no cost from the atmosphere. At higher elevations, the additional oxygen in the fuel might be an advantage.

Precisely because it has a lower energy content, ethanol also increases the octane rating of the fuel, so it is an inexpensive option for use in high compression engines.

Ideas for Young Scientists

If students are looking for an interesting science fair project, I hope my little experiment has given you some ideas. Even if you don’t have a driver’s license, you can recruit your parents to keep track of mileage when driving, and compare different fuels, or different types of driving, to see which is the most economical.

Interestingly, I exceeded the EPA mileage estimates for both fuels. There was a time when the EPA estimates were overly optimistic, but I guess those days are gone.

But Ethanol Will Clog My Fuel Filter!

Someone will invariably claim that ethanol clogs fuel filters, and I want to explain what is really happening.  Alcohol can mix with both water and gasoline.  Water, by itself, cannot mix with gasoline.  If you have 100% gasoline in your tank and some water is added, it is heavier than gasoline and will settle to the sump at the bottom of the tank, which is below the point where it can be drawn out by the fuel pump.  It doesn’t do any harm there, as long as it stays below the level of the fuel intake.  But it does dissolve dirt, and that dirt has nowhere to go but stay in the water.

Eventually, if water keeps getting added, it will continue to collect.  If it ever gets up to the level of the intake, then this will be a problem, since water mixed with dirt will be going to the engine rather than gasoline.  The fuel filter will clean out the dirt, but the engine will try to burn the water, and water doesn’t burn.

When ethanol was first added to gasoline in the U.S., this meant that it found its way, for the first time, into cars with water in the bottom of the tank.  The alcohol allowed the water and dirt to mix with the gasoline.  The dirt, which may have collected since the car was new, went into the fuel filter, as the filter was designed to do.  This is how ethanol got a reputation for clogging fuel filters.

But now, virtually all gasoline sold in the U.S. contains at least 10% ethanol, and virtually every car on the road has been burning 10% ethanol for years.  Water never gets a chance to build up in the tank.  If there is dirt in the tank, it comes out constantly.  Unlike the time the car got its first tank of ethanol, years’ accumulation of dirt is not coming out all at once to suddenly clog the filter.  So after that initial shock, ethanol actually corrects the problem, and also prevents gas line freeze.  In the days before ethanol fuel, in cold climates, people bought a product called Heet to prevent fuel line freezing.  This consisted either of ethanol or isopropyl alcohol.  Since ethanol is now included in the fuel, this is no longer necessary, and you rarely hear of gas lines freezing.


Some links on this page are affiliate links, meaning that this site earns a small commission if you make a purchase after clicking the link.

Science Fair Project: Homemade Battery

1961OctPE1If Junior is looking for a project for the science fair, a good standby is always making a battery out of materials found around the house. We’ve previously covered the idea in more detail, but the October 1961 issue of Popular Electronics shows a slight variation. All of these are a variation of Allesandro Volta‘s Voltaic pile from 1799, and are easy to recreate.

This one uses strips of copper and aluminum. The mechanical details are unimportant, so you don’t have to worry about the exact shape. The aluminum can be cut from a soda can, although these have a plastic lining on one side and paint on the other, so the aluminum will need to be sanded. If you don’t have a strip of copper available, a piece of copper wire, or any kind of copper hardware found at your local hardware store will work fine.

The 1961 article uses the battery to power a one-transistor radio. As you can see below, it consists of a crystal set with one germanium transistor amplifying the audio. But to show that the battery is working, a light emitting diode would work just fine. Polarity is important, so if it doesn’t light at first, simply reverse it in the circuit. In this battery, the copper is positive, and the aluminum is negative. It will come to life when the two electrodes are placed in salt water. As shown in this picture, you can carefully put one drop between the electrodes, or simply place it upside down in a glass of salt water.

Junior’s experiment for the science fair can be to see how much salt in the water results in the brightest glow. Or he or she can try different electrolytes, such as bleach or lemon juice. Very little can go wrong, and as long as some liquid is between the two strips, the LED is almost certain to give off a little light.

As we noted previously, the project is very easy with materials found around the house.  But for students who want to bypass the procurement process, you can simply go out and buy one of the potato clocks shown at left.

1961OctPE2


Some links on this page are affiliate links, meaning that this page earns a small commission if you make a purchase after clicking on the link.